Ask an experienced operator what a pump will actually do at a given flow rate, and they will usually reach for a single sheet of paper. That sheet — the pump performance curve — answers questions a nameplate never can: where the pump runs efficiently, how much head it gives up as flow increases, how much power it draws, and how much suction energy it needs to avoid cavitation.
At Sanlian Pump Industry we have been designing, casting and testing pumps since 1957, and one thing has not changed in that time: the people who read curves carefully are the ones who end up with quiet, reliable installations. This guide walks through the reading process the way our engineers do it with customers, one line at a time.
What a Pump Performance Curve Really Shows
A standard centrifugal pump curve comes from a factory test, not from a catalogue guess. Flow rate (Q) sits on the horizontal axis, usually in cubic metres per hour or gallons per minute. Head (H) sits on the vertical axis, in metres or feet. Unless the sheet says otherwise, the data assumes clean cold water, a fixed rotational speed, and a test procedure such as ISO 9906.
That last point matters. A curve describes one pump, with one impeller diameter, running at one speed. Change the impeller trim or the speed and you are looking at a different line. Many charts therefore show a family of head-flow curves for several impeller diameters, with efficiency, power and NPSHr curves drawn on the same flow axis. Before you read anything else, check the speed, the impeller diameter and the fluid assumptions printed in the corner of the chart.
Reading the Head-Flow Line, Step by Step
The head-flow curve is the backbone of the sheet. It slopes downward from left to right: as flow increases, the head the pump can generate falls. Reading a duty point from it takes four small steps.
- Locate your required flow rate on the horizontal axis.
- Move vertically until you meet the curve for the impeller diameter you intend to use.
- Move horizontally from that intersection to read the head on the vertical axis.
- Record the point, then repeat for the efficiency, power and NPSHr curves at the same flow.
Two landmarks frame every head-flow curve. At zero flow, the pump produces its highest head — the shutoff head — and the curve begins there. At the far right, the curve meets the horizontal axis at the runout or maximum flow point, where head has dropped to zero. Neither end is a sensible place to operate. Shutoff means the energy goes into heating the casing; runout means high velocity, high power draw and a strong chance of cavitation.
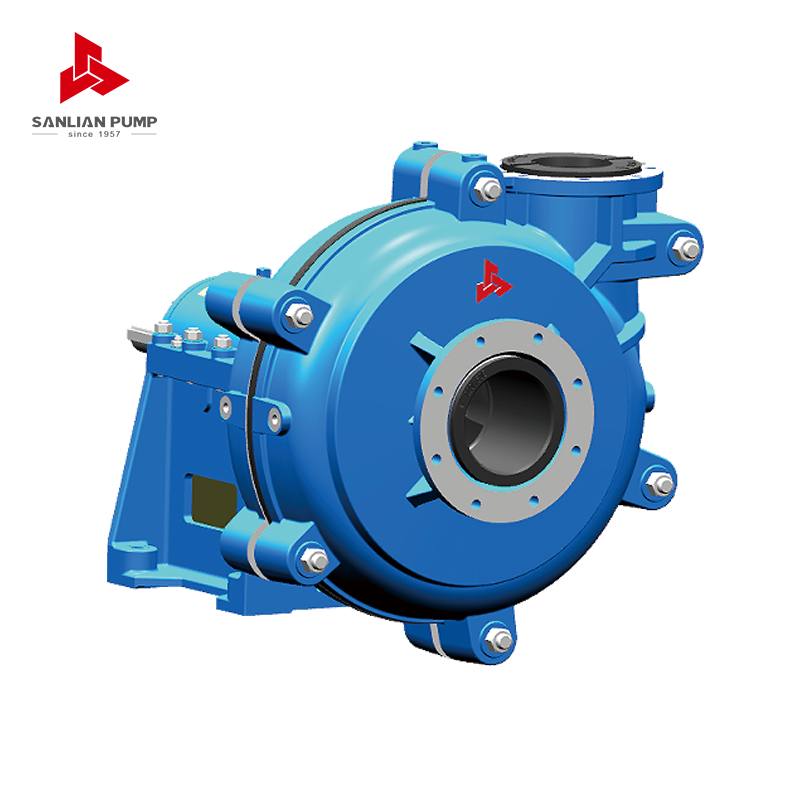
In practice, a good working band is roughly 80 to 110 percent of the flow at peak efficiency. For our
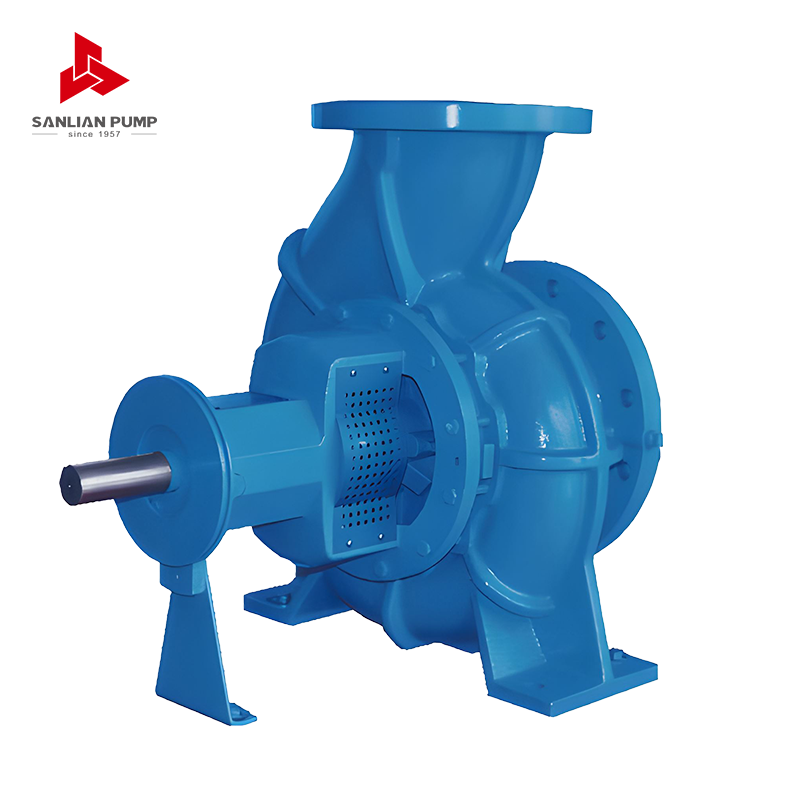 SPE Series Horizontal End-Suction Centrifugal PumpSPE horizontal single-stage end-suction centrifugal pump handles clean water across Q=6–1600 m³/h and H=5–125 m, with simple structure and stable performance.View Product →
range, for example, a back-pressure valve or a trimmed impeller is usually a better answer than running far off the design point.
The Efficiency Curve and the Best Efficiency Point
Efficiency is plotted as a hump: it climbs, peaks, then falls away again. The peak is the best efficiency point, or BEP, and it is the flow where hydraulic loads on the impeller and shaft are most balanced. Vibration, bearing load and seal wear are all lowest near this point.
Most standards describe a preferred operating region around the BEP and a wider allowable operating region beyond it. Inside the preferred region the pump behaves predictably. Outside the allowable region, the story changes quickly: too far left and you get recirculation, noise and a rising temperature rise across the casing; too far right and you risk cavitation, shaft deflection and shortened mechanical seal life.
When someone asks why two pumps with identical duty points behave differently, the answer is often that one sits at its BEP and the other sits on the shoulder of the curve.
Power, NPSHr and the Supporting Curves
The power curve tells you the shaft power absorbed at each flow. For most centrifugal pumps it rises with flow, which is why the motor is normally selected so that the power curve never crosses the motor rating anywhere on the chart — the classic non-overloading selection. A pump that is fine at duty point but overloads at runout will eventually trip a breaker.
The NPSHr curve shows the net positive suction head the pump needs to avoid cavitation, and it rises steeply as flow increases. Compare it with the NPSH available in your system, and keep a margin rather than matching the two numbers exactly.
Summary of the curves found on a typical centrifugal pump performance sheet and what each one is used for.
| Curve |
Vertical axis |
What it tells you |
What to watch |
| Head-flow (H-Q) |
Head in m |
Head available at any flow |
Stay inside the preferred band |
| Efficiency |
Percent |
Where the pump runs economically |
Locate the BEP first |
| Power (P) |
kW or bhp |
Shaft power absorbed |
Never exceed motor rating |
| NPSHr |
Metres |
Suction head needed to avoid cavitation |
Keep a safety margin over NPSHa |
Overlaying the System Curve to Find the Duty Point
A pump curve on its own only describes the pump. The system it feeds has its own curve: static lift plus friction losses, which rise with the square of the flow and produce a parabola starting from the static head. Draw both curves on the same axes and the intersection is the operating point — the flow and head the installation will actually settle at.
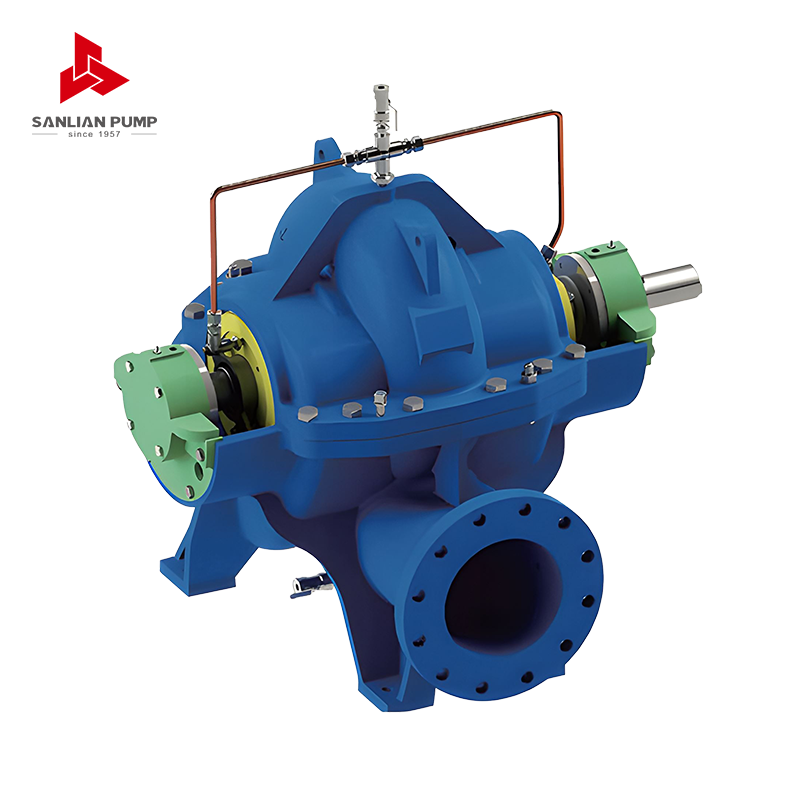
This is where most surprises appear. If the intersection sits well to the right of the design point, the pump is running out; if it sits far to the left, the pump is throttled by a system that needs more head than expected. Typical remedies are trimming the impeller, adjusting the control valve, or fitting a variable speed drive. Large double-suction machines used in water supply and plant circulating systems, such as the
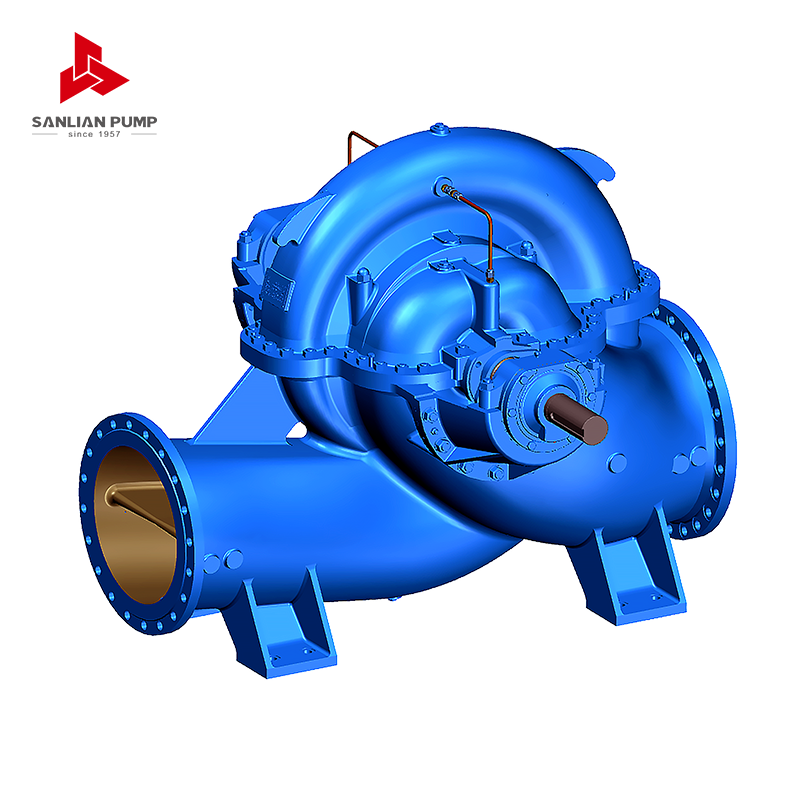 HS (V) Double-Suction Split Volute Centrifugal PumpSingle-stage double-suction pump for waterworks, power plants and HVAC, with flows up to 30,000 m³/h and heads up to 200 m; split casing eases maintenance.View Product →
, are often selected precisely so that the duty point lands close to the BEP across a wide flow range.
Multistage and Variable-Speed Curves
Multistage pumps stack several impellers on one shaft, and their curves are read the same way with one extra step: count the stages. Each stage contributes its own head rise, so the overall curve shifts upward as stage count increases, and internal stage curves are sometimes printed separately on the sheet. Minimum flow limits are more critical here, because the energy in a high-head machine has nowhere to go when the discharge is closed.
A
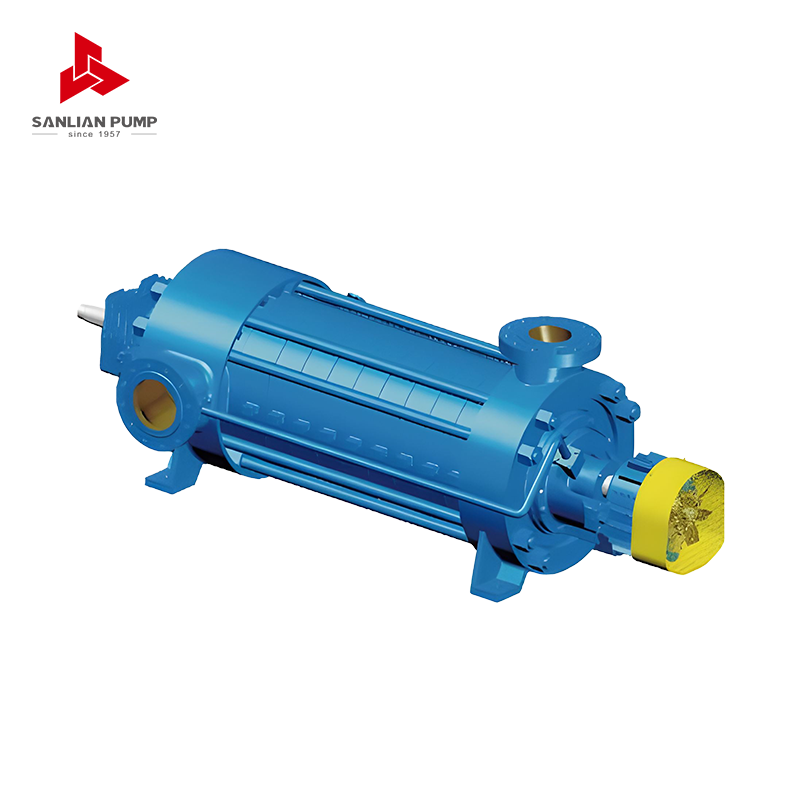 MD(S) Series Multi-Stage Centrifugal PumpHorizontal multi-stage pump for mine drainage and clear-water transfer, with Q=6.3–1250 m³/h, H=50–1000 m, and wear-resistant MD variants for mine water.View Product →
selected for boiler feed or mine dewatering duty should always be checked against its minimum flow line, not just its design point.
Variable speed adds a second layer. Affinity laws let you estimate the new curve: flow changes in proportion to speed, head with the square of speed, and power with the cube. That cube relationship is why slowing a pump by 20 percent can cut power consumption by around half. Plot the family of speed curves and the system curve together, and the control range becomes visible at a glance.
Practical Habits That Prevent Misreading
- Confirm the speed and impeller diameter the curve was drawn for before using any number from it.
- Check the fluid: viscosity, specific gravity and solids content all shift the curve, which is why slurry and chemical duties need their own correction.
- Read every curve at the same flow rate, never at the flow where each curve happens to look best.
- Keep an eye on minimum flow and runout limits, not only the duty point.
- Compare the catalogue curve with the factory test certificate when the pump arrives.
These habits take a few minutes and save weeks of troubleshooting. They also make conversations with suppliers much shorter, because everyone is reading the same lines.
From Curve to Confident Selection
Reading a pump performance curve is really a conversation between the pump and the system. Find the BEP, mark the preferred operating band, overlay the system curve, and confirm that power and NPSHr stay comfortable at every point the pump may visit — not only at the design flow. Do that, and the curve stops being a technical formality and becomes a working tool.
If you would like to go deeper into how head, flow and motor power interact in practice, our engineers have written a plain-language explanation of how pump head, flow rate and motor power determine performance. It pairs well with this guide. You can also see how these readings play out in real installations, such as the Puyang South-to-North water diversion supporting works, where duty points were matched to a varying demand profile.
Sanlian Pump Industry has spent nearly seven decades matching pumps to systems across chemical, mining, metallurgy, water supply and environmental projects. If a curve on your desk raises a question, send it over — reading it together is usually the fastest way to a sound decision.




 English
 中文简体
 Français
 Español
 Português
 عربى


 皖公网安备34052302341647号