A pump curve is not just a chart in a datasheet; it is the most practical tool for predicting whether a centrifugal pump will operate reliably in your system. When you can read the flow, head, efficiency, power, and NPSH curves correctly, you can catch mismatches before installation, avoid cavitation damage, and keep energy costs under control. This guide explains each element of a pump performance curve and shows how to use them together for real-world pump selection.
The Basics: Flow and Head on a Pump Curve
Every centrifugal pump curve starts with two axes. The horizontal axis is flow rate (Q), typically in cubic meters per hour (m³/h) or gallons per minute (GPM). The vertical axis is total dynamic head (H), usually in meters or feet. The main curve, often called the H-Q curve, shows the total head the pump can generate at each flow rate while running at a fixed speed.
Flow rate tells you how much liquid the pump moves per unit of time. Head describes the equivalent vertical height of liquid that the pump can supply; it combines static lift, pressure differences, and friction losses. A common mistake is to treat head as discharge pressure alone. Head is a better reference because it remains independent of fluid density, so the same curve can guide selection for water, chemical solutions, or light slurries. Pump curves are usually generated with cold water at 20°C, but the shape remains useful for many low-viscosity fluids.
Pump curve components and typical axis labels.
| Curve |
Typical axis values |
What it tells you |
| H-Q curve |
Flow on X, head on Y |
Pressure-generating ability at each flow |
| Efficiency curve |
Flow on X, efficiency % on Y |
Where the pump runs most efficiently (BEP) |
| Power curve |
Flow on X, shaft power on Y |
Motor power required to drive the pump |
| NPSHR curve |
Flow on X, NPSH required on Y |
Minimum suction pressure to avoid cavitation |
Manufacturers may also include multiple curves for different speeds or impeller diameters on the same chart. Keep track of which secondary scale belongs to which curve so you do not misread the data.
The Head-Flow Curve and the Operating Point
The H-Q curve normally descends from a maximum head at shut-off, zero flow, toward a lower head at maximum flow. This shape comes from hydraulic losses inside the impeller and casing. As flow increases, fluid friction and internal turbulence reduce the pressure produced.
The curve alone does not tell you where the pump will run. You also need the system curve, which defines the head required to push fluid through pipes, valves, and equipment at each flow rate. The intersection of the pump curve and the system curve is the actual operating point. If the system curve changes, for example because of a partially closed valve, the operating point moves along the pump curve. Always compare this operating point with the rated duty point shown in the pump specification. A large gap between them means the pump may be operating outside its intended range.
Efficiency Curves and the Best Efficiency Point
Most performance charts include an efficiency curve, usually on a secondary y-axis. Efficiency rises from zero at shut-off to a maximum at the Best Efficiency Point (BEP), then falls as flow increases. BEP is the flow rate at which the pump converts input power to useful hydraulic energy most effectively.
Operating near BEP is essential for reliability. At BEP, hydraulic forces are balanced, vibration is low, and bearing loads are moderate. Moving far to the left or right can cause recirculation, cavitation, or shaft deflection. When you review a pump curve, mark the recommended operating range, typically 70 to 110 percent of BEP flow. Be aware that pump tests follow standards such as ISO 9906, and the tested point can vary by a few percent from the published curve. That small tolerance is normal, but it should not change your operating point by more than a few meters of head.
Power Curves and Motor Selection
The power curve shows the shaft power consumed by the pump at different flow rates. For a centrifugal pump, shaft power usually increases as flow increases, so the highest brake horsepower occurs at the upper end of the curve. The motor rating must be larger than the maximum shaft power on the curve, with an appropriate service factor.
Fluid specific gravity changes the required power even though it does not change head. If the pump will handle a liquid heavier than water, multiply the shaft power by the specific gravity. A motor sized for water may trip or overheat when running on a dense slurry or high-density chemical. For abrasive or corrosive fluids, this extra margin is not optional; always confirm the selected motor kW with the pump supplier before purchasing.
NPSH Curves and Cavitation Prevention
The NPSHR curve shows the minimum suction pressure needed at the pump inlet to prevent vaporization inside the impeller. NPSHR generally rises as flow increases, because higher velocities in the impeller eye produce a larger pressure drop and the pump begins to cavitate slightly before the curve is drawn. Most standards define NPSHR based on a 3% head drop, so there is already a small amount of cavitation at the curve point.
To be safe, keep NPSHA above NPSHR by a margin of at least 0.5 to 1.0 metre. If the margin is too small, the pump will run noisily, vibrate, and eventually damage the impeller. Check the NPSHR value at the operating flow, not just at BEP, because the gap between the two can be significant, especially in high-flow services.
Impeller Trim and Curve Families
Many centrifugal pumps are available with several impeller diameters. The data sheet then shows a family of curves, with one curve per diameter. A larger impeller gives more head at the same flow; a smaller impeller moves the curve downward. Trimming the impeller lets you match the pump to a specific duty point without changing the casing or motor.
Efficiency islands are also shown on some curves; these closed loops make it easy to see how efficiency changes with impeller trim. Avoid selecting an impeller that is trimmed too far from the maximum size, because efficiency drops and wear increases. A simple rule is that a 5% reduction in impeller diameter reduces head by roughly 10% at the same speed. Use the curve family to find the minimum trim that still meets the duty point and stays near the BEP.
Applying Pump Curves in Real Selection
Now that you know the building blocks, a practical selection sequence is simple:
- Determine the required flow and total dynamic head for your system.
- Build or draw the system resistance curve.
- Overlay the system curve on the pump performance chart and read the intersection.
- Check that this operating point falls inside the recommended efficiency range, preferably near BEP.
- Verify that the selected impeller diameter provides enough motor power margin.
- Confirm that NPSHA is higher than NPSHR at the operating flow.
This process works for nearly every centrifugal pump data sheet. When you review the performance curve of a pump like our SPE series horizontal centrifugal pump, you can apply these exact steps without any special software. For a related discussion of how head, flow, and motor power interact in pump sizing, see our technical note on pump head, flow rate, and motor power.
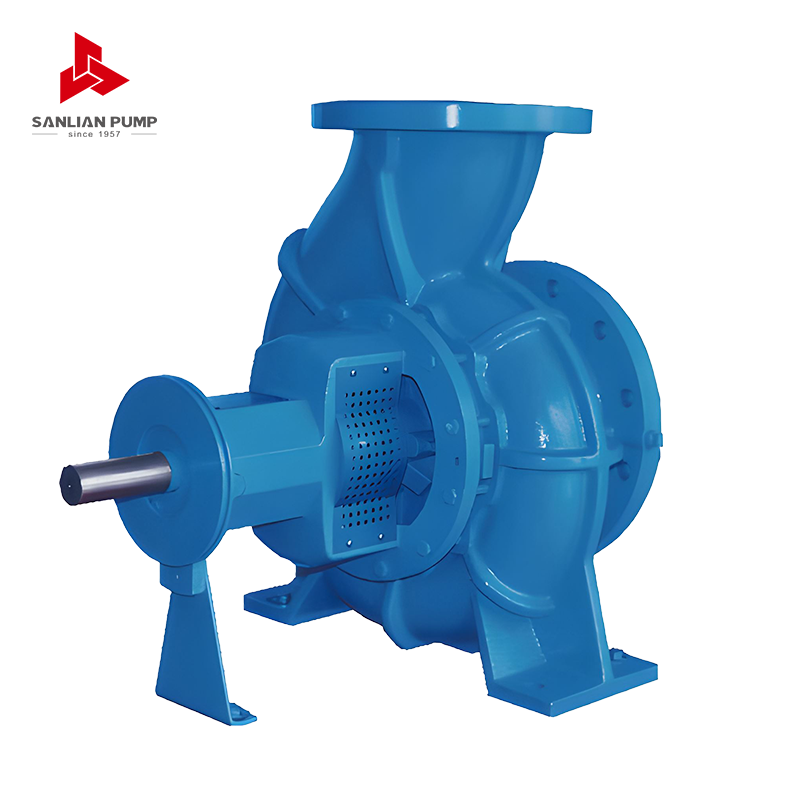 Custom SPE series horizontal single-stage end-suction centrifugal pump SuppliersSanlian Pump is China SPE series horizontal single-stage end-suction centrifugal pump Suppliers and Custom SPE series horizontal single-s...View Product →
Reading pump curves is a skill that saves time, money, and maintenance headaches. Start with the operating point, then check efficiency, power, and NPSH; when these four elements are aligned, you have a pump selection you can trust. If you are working on a specific application and need help interpreting performance data, a quick conversation with an application engineer can clarify the right choices.




 English
 中文简体
中文简体 Français
 Español
 Português
 عربى
عربى

 皖公网安备34052302341647号